Classification of User Reviews
Data Scientist Associate Practical Exam
Background given by Datacamp
This project was part of the Datacamp certification with the following background given:
EMO is a manufacturer of electric motorcycles. EMO launched its first electric motorcycle in India in 2019. The product team has been asking website users to rate the motorcycles. Ratings from owners help the product team to improve the quality of the motorcycles. Ratings from non-owners help the product team add new features. They hope the new features will increase the number of new customers. The product team wants to extend the survey. But, they want to be sure they can predict whether the ratings came from owners or non-owners.
Data validation
I started the analysis by making sure that the data fits the criteria:
- owned: Has only values of “0” and “1” with no missing values. Fits the criteria. Was converted to factor.
- make_model: Fits the description with no missing values.
- review_month: Some observations had not only the month but also the day included, removed everything but the shortened name of the month. No missing values.
- web_browser: Replaced 150 missing values with “unknown”. Other values fit the description.
- reviewer_age: Replaced 105 missing values with mean age and converted from character to integer.
- primary_use: No missing values, fits description.
- value_for_money: Was given as a string including “/10”. Removed that part and converted the remaining number indicating the rating to integer. No missing values.
- overall_rating: Values are within range without missing values, fit the description as is.
Visualization of ownership
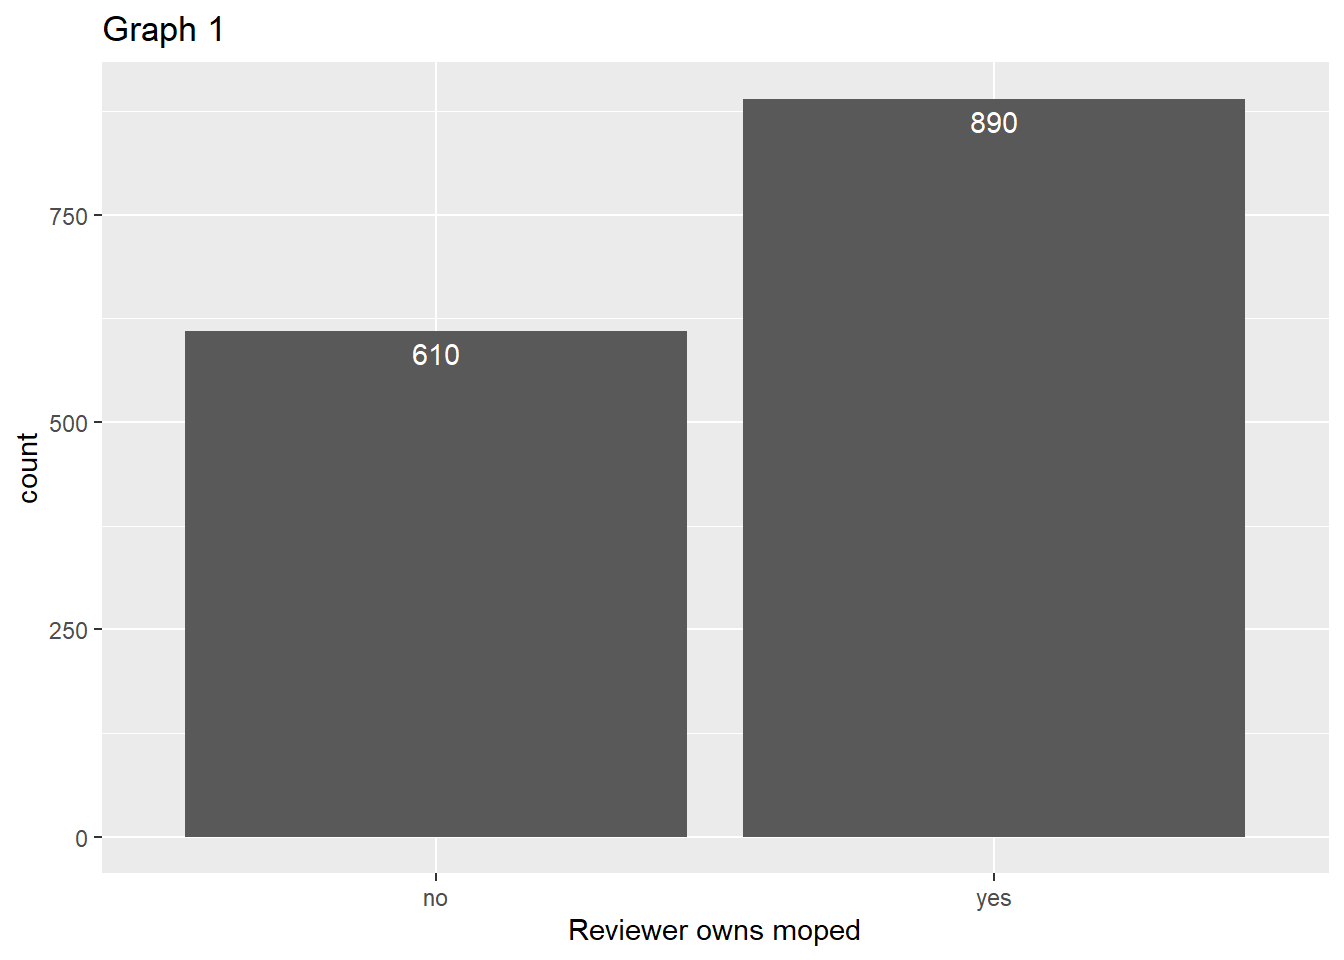
As seen in Graph 1 most reviews (890) are from people who own the reviewed moped, while there are fewer reviews from people not owning the reviewed moped (610). There are roughly 1.46 times as many reviews from owners than form non-owners. While this is a bit unbalanced there are still enough observations in both categories to not do anything about the imbalance.
Distribution of overall rating
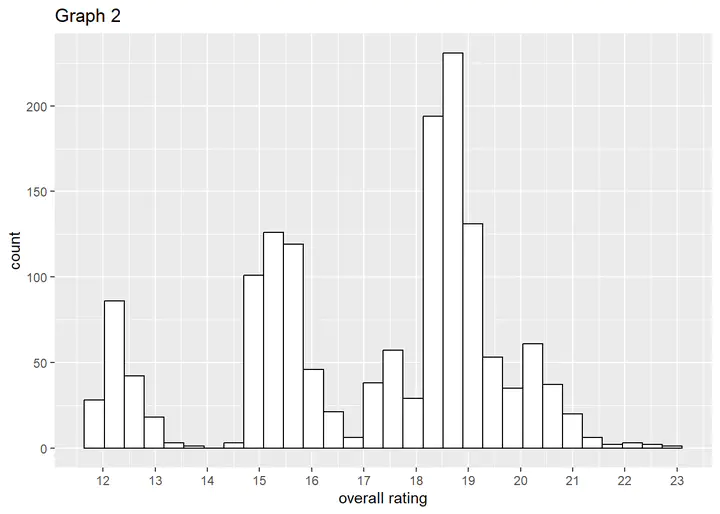
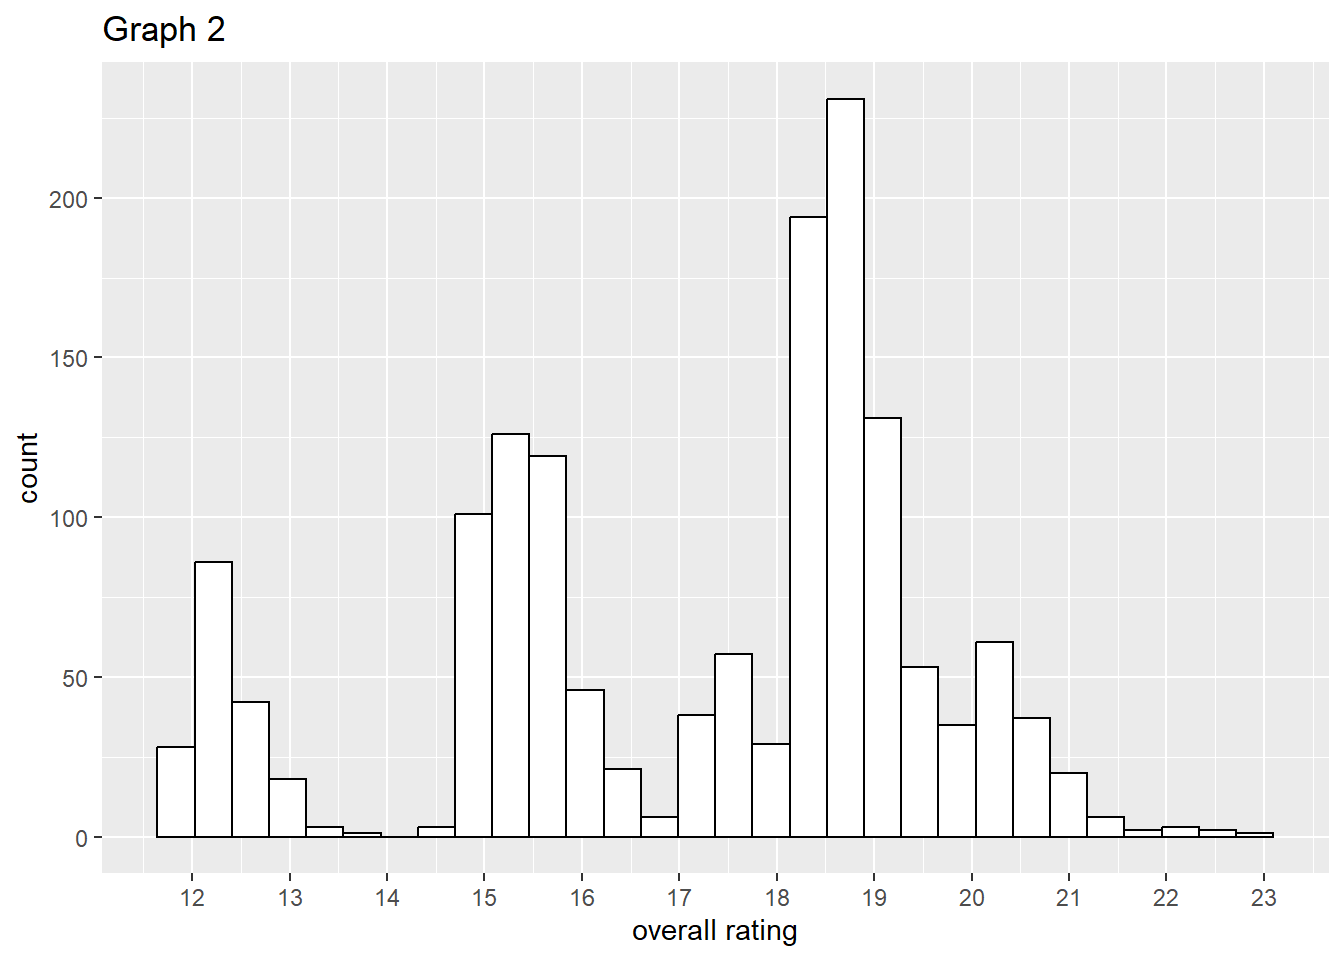
As visualized in Graph 2, the distribution of overall rating is a multimodal distribution with three main peaks at around 12.25, 15.5 and 18.5. The mean of the distribution is 17.14 and the standard derivation 2.45.
The relationship between overall rating and ownership
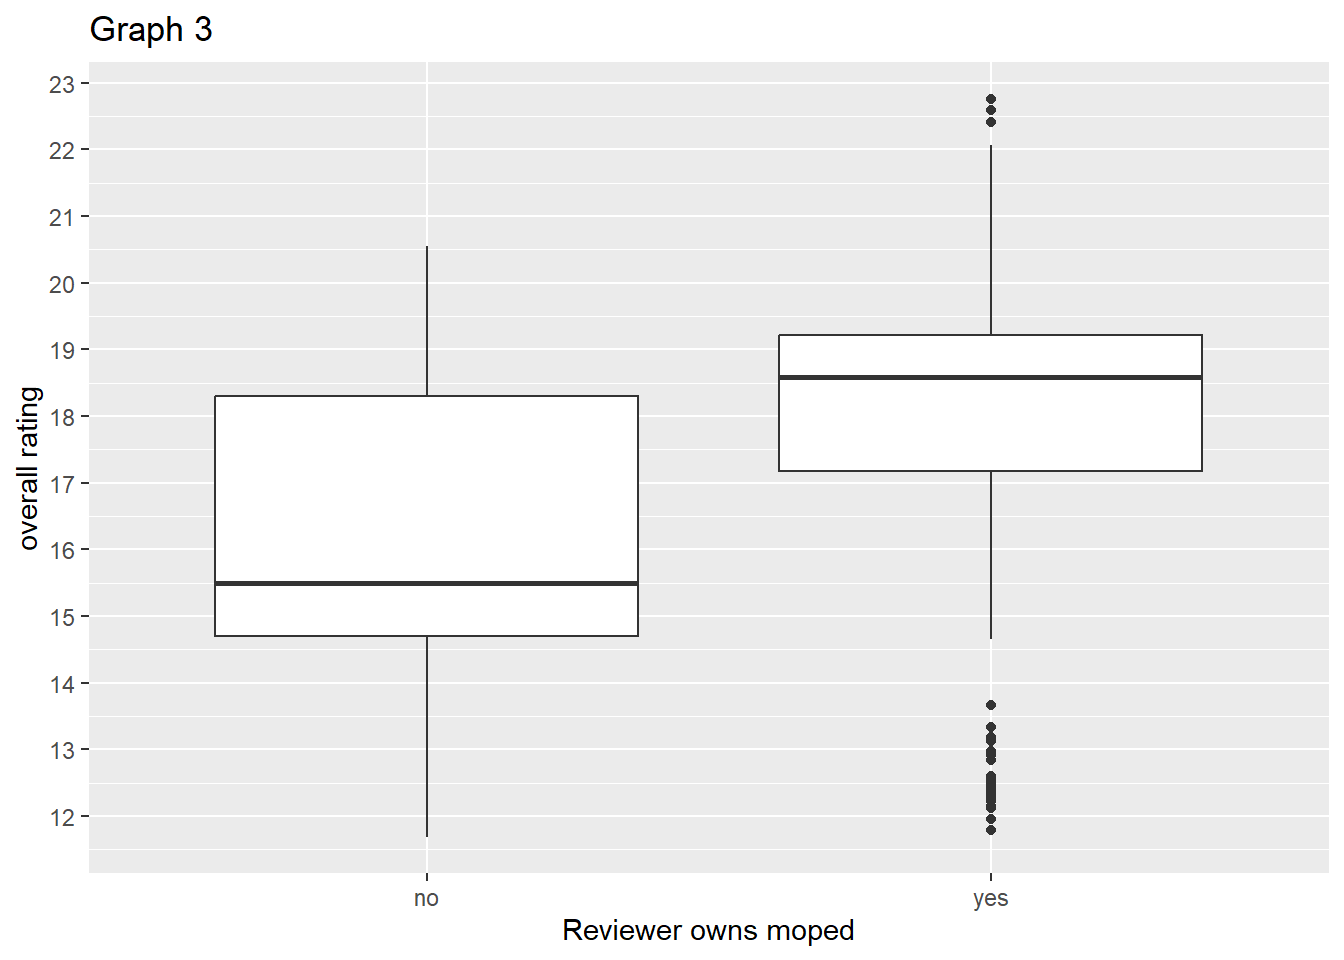
The relationship between overall rating and ownership can be seen in Graph 3. The reviews from owners are on average higher than those of non-owners and the interquartile range of overall rating by owners is lower than the interquartile range of overall rating by non-owners. There are some outliers but I don’t see a justification for excluding them from further analysis.
What type of machine learning problem?
The business wants to predict whether a review came from an owner or not using the data provided. This is a binary classification problem.
Fitting a baseline model
Before fitting a baseline model, I will split the data into a test and training data set. Then I will fit a logistic regression model as a baseline model.
Fitting a comparison model
After the baseline model a random forest model is implemented as a comparison model.
Why those models?
I choose a binomial logistic regression as a baseline model and a random forest model as a comparison model. Both models are suitable for classification problems, i.e. the type of problem we have to solve here. The binomial logistic regression model was chosen because it is fast and easy to interpret. The advantage of the random forest model is that it is better suited for non-linearities as well as data containing many features and a large number of observations.
Comparing model performance
To compare the performance of both models I compare the acuracy of both models, i.e. the proportion of correct predictions of all predictions, because that measure is easy to interpret. The acuracy of the baseline model is 74%, while the acuracy of the random forest model is 72%. This means that the baseline model performs better on the given data in the sense that it makes more correct predictions.
Which model is better?
The random forest model performs worse than the baseline logistic regression model if we look at the acuracy of both models. As stated earlier the random forest approach is a better choice for non-linear relations as well as data sets with many features and observations. That the model did worse than the logistic regression model could be a sign of the relation being in fact linear, as assumed in the logistic regression approach. There are also not that many features in the data, so the random forest algorithm could not use it’s strength there.